Hey mate. I would love it if you would share to me your trick in there. Can you give me an overview of what you are doing? And how? Also a step-by-step procedure to it? My professor is asking for a detailed review of this and I do not have any idea if what it is all about. I wish you could help me? Or any suggestions, My paper is due on Tuesday. Thanks mate.mr.sande wrote:I have been using Gephi for a school assignment. Me and another student used Gephi to explore the source code of a couple of software projects. maybe there is some other website that I could go to?
The code we wrote isn't perfect, its only meant to be good enough to do the assignment.
The code and .gdf files are available at:
https://code.google.com/p/source-code-visualtisation/
#madewithgephi : the community talks about their studies
-
ihanna
- Posts:1
- Joined:10 Jun 2012 16:04 [phpBB Debug] PHP Warning: in file [ROOT]/vendor/twig/twig/lib/Twig/Extension/Core.php on line 1275: count(): Parameter must be an array or an object that implements Countable
-
joemitchell
- Posts:1
- Joined:12 Dec 2012 22:51 [phpBB Debug] PHP Warning: in file [ROOT]/vendor/twig/twig/lib/Twig/Extension/Core.php on line 1275: count(): Parameter must be an array or an object that implements Countable
Re: #madewithgephi : the community talks about their studies
Hello Gephi-ers,
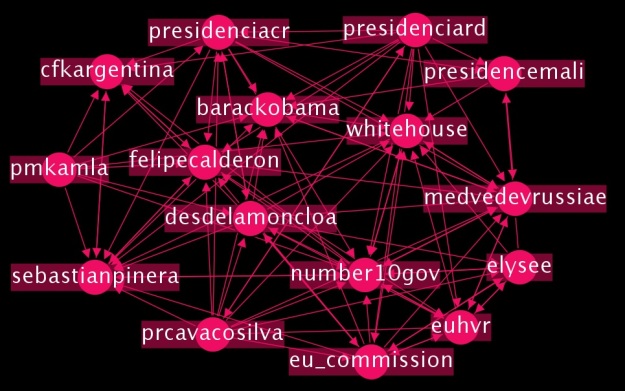
Here's a use of Gephi to map the network of twiplomacy (world leaders on twitter.
http://joe-mitchell.com/2012/12/07/draw ... diplomats/
One example below:

I would really appreciate any expert feedback on how to do some more complex visualisation, such as how to weight nodes or edges by number of replies/RTs etc. There are lots more ideas in the blog post.
Any other ideas of ways to represent this stuff are very welcome! (For example, I think some dynamic analysis - watching new leaders join the Twiplomacy network and see who connects with them quickest, would be great fun.)
Thanks for reading.
Here's a use of Gephi to map the network of twiplomacy (world leaders on twitter.
http://joe-mitchell.com/2012/12/07/draw ... diplomats/
One example below:

I would really appreciate any expert feedback on how to do some more complex visualisation, such as how to weight nodes or edges by number of replies/RTs etc. There are lots more ideas in the blog post.
Any other ideas of ways to represent this stuff are very welcome! (For example, I think some dynamic analysis - watching new leaders join the Twiplomacy network and see who connects with them quickest, would be great fun.)
Thanks for reading.
Re: #madewithgephi : the community talks about their studies
thanks for your sharing very much !
i will use them well . Great forum to visit.
Regard !
Jay
speakers for tv/ wall-mountable sound bar /home theater sound bar system /wireless subwoofer
i will use them well . Great forum to visit.
Regard !
Jay
speakers for tv/ wall-mountable sound bar /home theater sound bar system /wireless subwoofer