Regard !
Jay
speakers for tv/ wall-mountable sound bar /home theater sound bar system /wireless subwoofer
Statistics:Posted by jay.pi99 — 15 Aug 2014 04:58
]]>
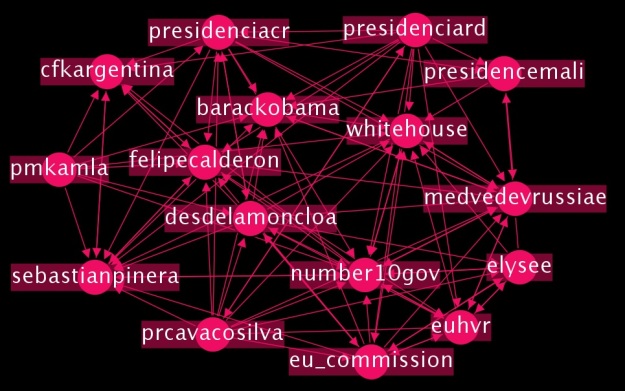
Here's a use of Gephi to map the network of twiplomacy (world leaders on twitter.
http://joe-mitchell.com/2012/12/07/draw ... diplomats/
One example below:
I would really appreciate any expert feedback on how to do some more complex visualisation, such as how to weight nodes or edges by number of replies/RTs etc. There are lots more ideas in the blog post.
Any other ideas of ways to represent this stuff are very welcome! (For example, I think some dynamic analysis - watching new leaders join the Twiplomacy network and see who connects with them quickest, would be great fun.)
Thanks for reading.
Statistics:Posted by joemitchell — 15 Dec 2012 12:51
]]>
mr.sande wrote:I have been using Gephi for a school assignment. Me and another student used Gephi to explore the source code of a couple of software projects. maybe there is some other website that I could go to?
The code we wrote isn't perfect, its only meant to be good enough to do the assignment.
The code and .gdf files are available at:
https://code.google.com/p/source-code-visualtisation/
Hey mate. I would love it if you would share to me your trick in there. Can you give me an overview of what you are doing? And how? Also a step-by-step procedure to it? My professor is asking for a detailed review of this and I do not have any idea if what it is all about. I wish you could help me? Or any suggestions, My paper is due on Tuesday. Thanks mate.The code we wrote isn't perfect, its only meant to be good enough to do the assignment.
The code and .gdf files are available at:
https://code.google.com/p/source-code-visualtisation/
Statistics:Posted by ihanna — 10 Jun 2012 16:07
]]>
The code and .gdf files are available at:
https://code.google.com/p/source-code-visualtisation/
Statistics:Posted by mr.sande — 25 Mar 2012 23:04
]]>
http://www.sciencedirect.com/science/ar ... 9711001996
And here's a prototype of the web site which Alexis Jacomy (formerly with Gephi) helped in putting it together.
http://research.cchmc.org/od
Thanks
anil
Statistics:Posted by ajegga — 15 Feb 2012 20:26
]]>
I don't know if this is the right thread for this post but here we go:
If someone is interested in a 24h dataset of the tweets containing the word "oslo" after the tragedy, you can get it from my blog:
http://verkostoanatomia.wordpress.com/2 ... a-dataset/
There are 287 files. Format is GraphML and the file name contains the time of the crawl (+2 GMT). If you know a convenient way of importing these in to single gexf-file with timestamps, let me know.
Statistics:Posted by jattipaa — 30 Jul 2011 13:04
]]>
]]>
http://www.youtube.com/watch?v=z3Wo22jl4Ac
Statistics:Posted by elijah — 01 Mar 2011 23:41
]]>
admin wrote:Cool! But what do the links mean?
Besides the labeled nodes, there are 2400 contributor nodes (you can see some of the more voluminous contributors as their own nexus) and 10,600 "edit" nodes (at the point where the curved edge switches from being curved one way to another). The edit nodes are all labeled by unixtime and have an edge to the editor and an edge to the page edited. I'd rather do it this way for the dynamic graph than build the gexf with edge value variation. So if you made an edit to the Algerian Protests page, then one node would be Sebastien, one node would be Sebastien_edits_Algerian_Protests_1297454400, and one node would be Algerian_Protests. The edit nodes are colored by their unixtime value, and the edges are set to inherit their target color (the graph is directed for aesthetic sake with Page->Edit, Contributor->Edit). Hope that makes more sense, I'll make sure when I get the animated version up to label everything and write up a more detailed explanation.Also:
http://www.poetryfoundation.org/harriet ... more-22423
The Poetry Foundation did a story on my representation of Robert Creeley's email correspondence.
Statistics:Posted by elijah — 21 Feb 2011 16:57
]]>
]]>
10,621 Edits
2,427 Wikipedians
17 Wikipedia pages
81 days
And as soon as that Merge Columns issue is fixed, I'll have a few animated versions. I'll also be releasing this dataset for folks to play with.
Statistics:Posted by elijah — 20 Feb 2011 21:38
]]>
]]>
The following links are a compilation of these works:
Real-world softwares
Truthy, online Twitter meme tracker made by the Indiana University Center for Complex Networks and Systems Research
LinkedIn InMaps
Bio4j uses the Gephi Toolkit for the visualization part of gene ontology
Social networks
Twitter hashtag map seen on the Bloomberg TV show "Money Moves"
Visualization of votes in the Norwegian Parliament
Visualized: A School Day as Data (video)
Github explorer
Giorgio Agamben: Magic and Happiness
Moscow Venues Graph Analysis
Berlin Venues Graph Analysis
Network analysis of associative user-generated relations – re:publica 2010 workshop
Social Network Analysis using R and Gephi
Data preparation for Social Network Analysis using R and Gephi
Effectiveness of social media in education - following the conversations
The social network of economists
White House Visitation Social Network
Plotting Comment Networks in Gephi, Part II – Merging Datasets Using Google Fusion Tables
Football! – FIFA 2010 World Cup as Networks
DJ Patil explaining LinkedIn social graph visualizations
Driving through time, Formula 1 drivers' social networks
Social network of the Finnish cabinets visualized
The "dynamique d'enfer" of cultural networks, innovation, and inclusive exclusivity as a strategy for survival.
hackMTL: Inbox Social Network Visualization
Deutsche Lobbyverbände nach Stichworten
Twitter networks
First Glimpses of the OUConf10 Hashtag Community
Interactive viz of twitter hashtag community using gephi/gexfwalker
Visualizing ALTC2010 Twitter Backchannel
Small World? A Snapshot of How My Twitter “Friends” Follow Each Other…
Using Gephi to visually identify the OU LIbrarians in my Twitter Friends network
Twitter @reply Networks on #ausvotes
Conan O’Brien communities visualized -teamcoco’s everywhere!
Hadoop World 2010 Tweet Analysis
http://radar.oreilly.com/2010/12/graph- ... twork.html
Paris, la Gaîté Lyrique, 3-4 mai 2001 Trois visualisations des tweets des Rencontres Culture Numérique
Twitterpolitik Netzwerke und Themen der politischen Twittersphäre in Österreich
Facebook networks
What can we learn about Somalis from their Facebook networks?
Getting Started With Gephi Network Visualisation App – My Facebook Network, Part I
Getting Started With Gephi Network Visualisation App – My Facebook Network, Part II: Basic Filters
Getting Started With Gephi Network Visualisation App – My Facebook Network, Part III: Ego Filters and Simple Network Stats
Getting Started With Gephi Network Visualisation App – My Facebook Network, Part IV: Finding and visualising clusters
Getting Started With Gephi Network Visualisation App – My Facebook Network, Part V – visualizing partitions the proper way
Analyzing networks with Gephi: McKinsey Facebook group case
Gephi y gafo de contactos de Facebook
Using Netvizz & Gephi to Analyze a Facebook Network
Identity & Pattern Recognition (Fashion Design), see also the video
Mitch 2.0: Network Science, Facebook and Economics
Email networks
Syria: Asma and Bashar al-Assad's email network
Web networks
Understanding Industry Verticals Through Backlink Visualisation and Analysis
Webcómics en español online community mapping
First Steps in Mapping the Australian Blogosphere
Mapping the Australian Blogosphere some more
Machine learning blogs
Ontologies
AI³ leaves Cytoscape to Gephi
Financial networks
Interlocking directorate (corporate networks) by OpesC
Biological networks
Functional Networks in Yeast
Using Apache Hadoop to Find Signal in the Noise: Analyzing Adverse Drug Events
Semantic networks
Visualizing Texts as Networks
The Guardian and UK Elections
Gephi - Una herramienta para visualizacion de grafos
Live event represented as a graph of relationships
Twitter Concept Mapping with Wordstat and Gephi: First Steps
Visualising topic-based conversation networks: the #masterchef edition
The Future of Journalism: A Network Visualization
Text network analysis with Gephi step by step
A full-text visualization of the WikiLeaks Iraq War Logs made with Gephi
Infrastructure networks
Airlines Routes Network Analysis according to Gephi
Visualizing Infrastructure as Code
Ubuntu Packages
Bibliometric / scientometric networks
Visualizing the RecSysTEL workshop
Science overlay maps with Gephi on Leydesdorff.net
Co-authorship Network of SSRN Conflict Studies eJournal, by Drew Conway
Citography: the visualization of nineteen thousand journals through their recent citations
The authorship network of genome-wide association studies
Other networks
Visualising Related Entries in Wikipedia Using Gephi
Mapping How Programming Languages Influenced Each Other According to Wikipedia
Graphing the history of philosophy from Wikipedia
Visualising Vodafone Mclaren F1 Telemetry Data in Gephi
Eurovision 2010 voting network
movie relationships analyzed on OZON.ru
The Real Network of Countries
Graph Structure of an Open Science Notebook – “Linked Science”
Visualizing Databases
Visualising Networks in Gephi via a Scraperwiki Exported GEXF File
Statistics:Posted by admin — 16 Apr 2010 14:32
]]>